Environmental data platform - built for apparel and footwear brands, and their suppliers.
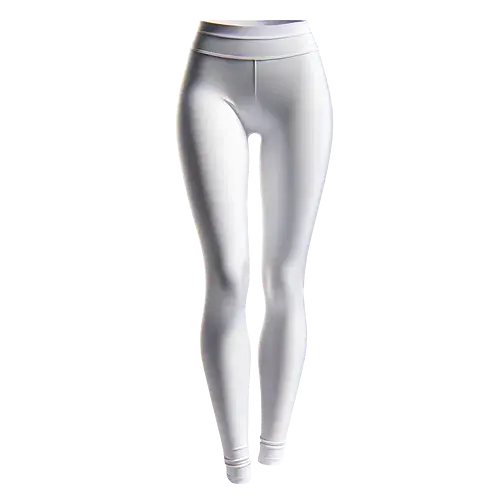
What's the Carbon Footprint of Leggings?
- Minimum footprint: 2.27 kg CO2e
- Median footprint: 6.16 kg CO2e
- Maximum footprint: 19.9 kg CO2e
 Leggings Carbon Footprint
The DPP for textiles will be mandatory from 2027/2028 for all textile and apparel products sold in the EU.
The Digital Product Passport for an Leggings ideally should contain information about
The provided emissions range of 2.27 - 19.90 kg CO₂e per pair of leggings indicates a significant variation of up to 17.63 kg CO₂e within this product category. This variation could be influenced by factors like material composition, manufacturing processes, or transportation.
The raw materials phase accounts for 0.59 kg CO₂e of emissions per leggings, emerging as one of the top contributors. Optimizing raw material sourcing and increasing use of lower-impact fibers could help reduce the footprint.
Yarn formation is another key hotspot, responsible for 0.82 kg CO₂e per leggings on average. Improving energy efficiency and adopting renewable energy in this process step presents an opportunity for impact reduction.
The coloration process contributes 0.47 kg CO₂e per leggings, indicating that dye selection, water use, and treatment processes influence the overall footprint. Exploring cleaner dyeing technologies could yield environmental benefits.
Product LCA | Carbon Accounting | Reporting | Eco-Design

CHOSEN by 200+ BRANDS AND SUPPLIERS
"Shoes can consist of up to 1500 components. Before Carbonfact, we asked our developers to weigh every single piece but such a manual approach is not scalable. Carbonfact helped us in deriving rules to overcome data gaps by creating accurate assumptions."

"With Carbonfact we can do full product LCAs on all of our products. Thanks to measuring things early on, we can simulate how a new product is going to have a different impact compared to the current version. For example, one of our new products is expected to decrease its footprint by a fourth just by designing it differently."

"We needed a solution that could handle the complexities of the apparel supply chain, provide year-to-date insights, and support with detailed scenario analyses for our supply chain. For us Carbonfact is not just a Carbon Management Software, but an extension of our sustainability team."

"What's really special about Carbonfact is the way that it can work alongside the VF brands to help identify where there are gaps in our product impact data. But also helping us bridge towards improving that data. So it's much more of a partner to solve the challenges we have."

"The Explorer is, for sure, my favorite feature. I love the ability to look at the breakdown of the carbon footprint per product line, for processes or on a material basis. That's so dynamic that we're able to leverage it in different ways depending on the projects that we're working on or the teams that we're engaging with."

"Carbonfact's offerings, particularly its product-level focus for footwear and apparel, ensures we can both measure our carbon footprint and actively find ways to reduce it. Carbonfact has been instrumental in helping us model different scenarios and make informed decisions that align with our sustainability goals."

"We have moved from spend-based carbon accounting into Carbonfact to prioritize primary data and get more accurate calculations. The main reason for us to choose Carbonfact is that we now not only get our company's total carbon footprint but also break it down for each of our products."


© 2026 Kanso, Inc. All rights reserved.
If you click on “Accept all” you agree to the use of these cookies. To find out more about the cookies we use, see our Privacy & Cookie Policy. Or, you can continue without agreeing .