


Environmental intelligence platform - built for apparel and footwear brands, and their suppliers.

The fashion and textile industry is a large contributor to climate change. It contributes to around 4% or 2 GTCo2e1 out of the 50 GTons of CO2e that humanity produces.
But the industry is also a massive polluter in other areas. It consumes 4% of fresh water2, is responsible for 16% of the global plastic pollution3, and uses over 8,000 chemical substances.
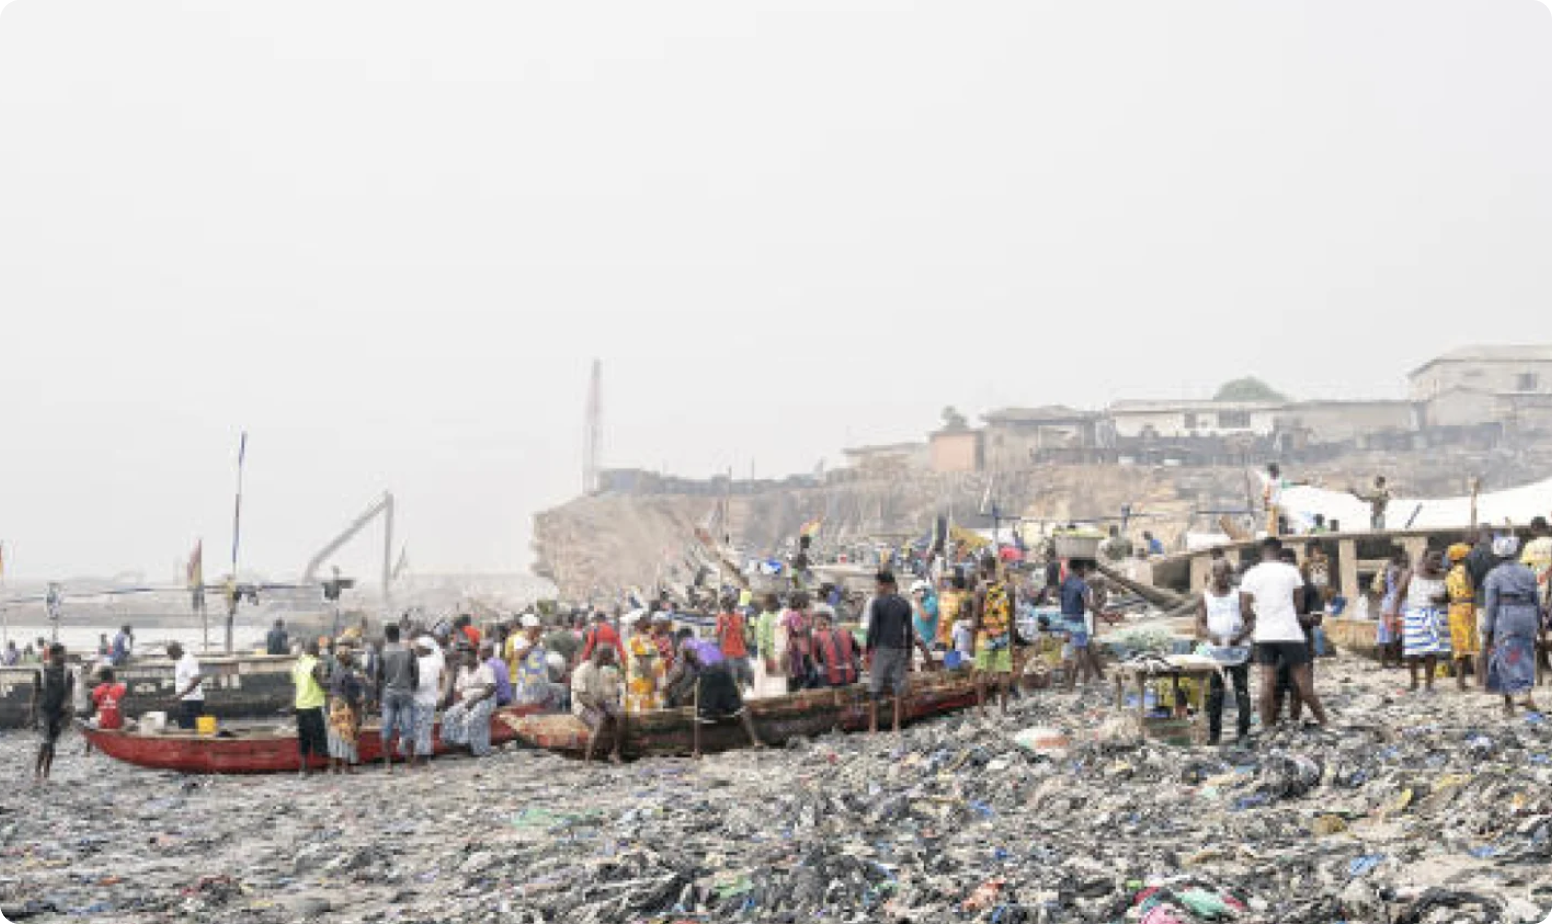
A picture of the harbor of Accra, Ghana. Every week, Ghana receives 15m pieces of garments for a population of 30m. Source: Le Monde.
While our mission is to decarbonize the fashion industry, the Carbonfact platform also provides our customers with multi-criteria measurement across the 16 indicators defined by the Product Environmental Footprint (PEF) methodology. You can learn more about our LCA features here.
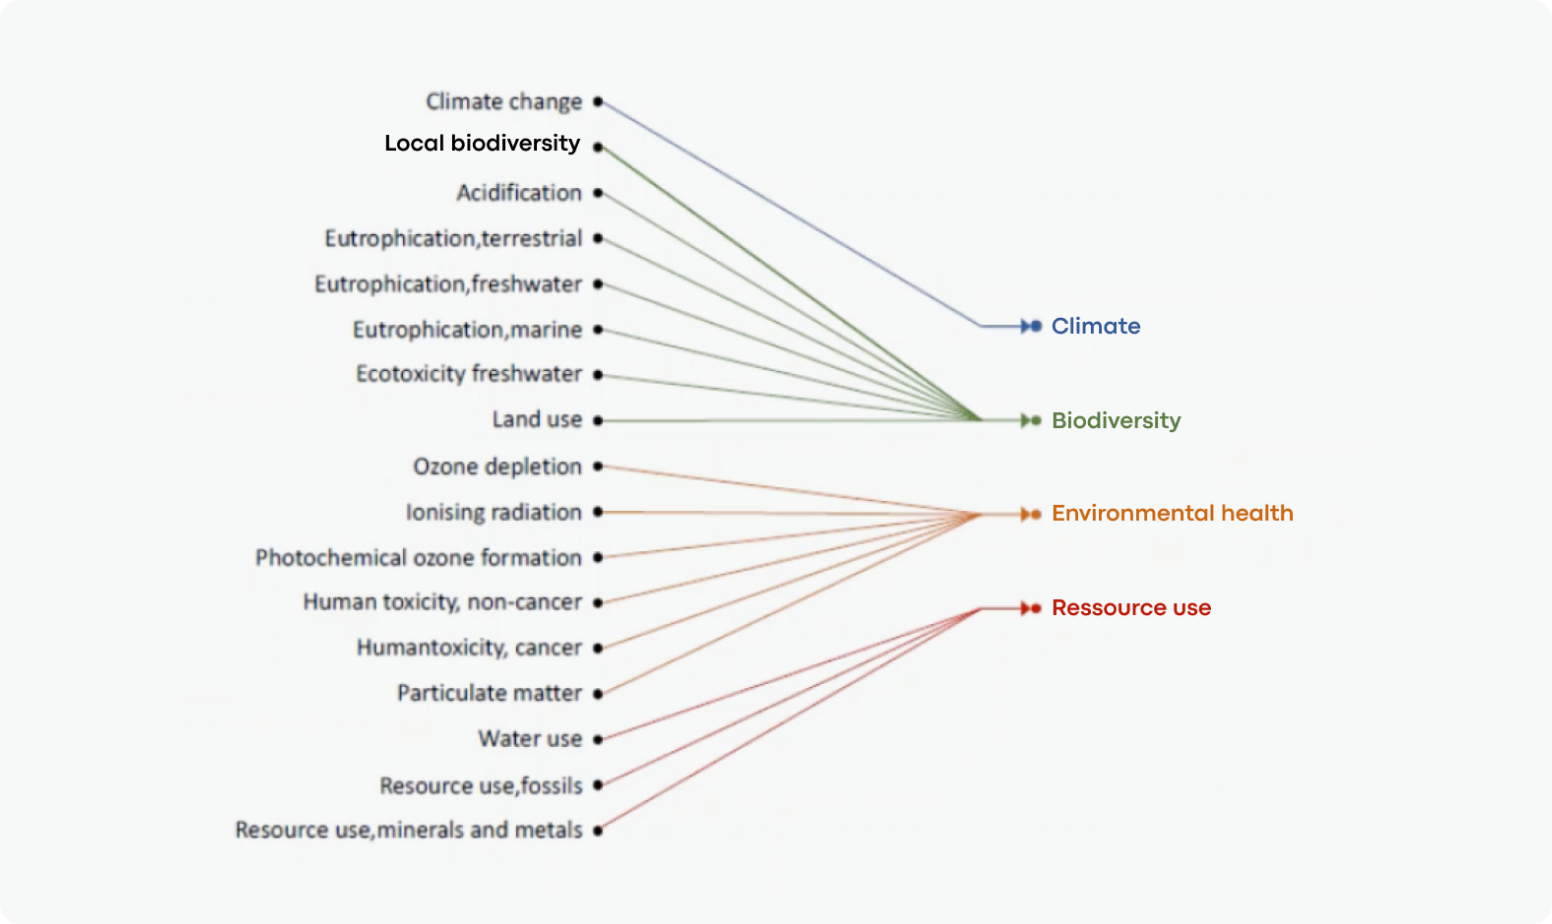
A visualization of the different environmental indicators of the PEFCR.
I also often hear about the risk of Carbon Tunnel vision, and solely optimizing for carbon while overlooking other indicators, so I decided to take a data-driven look at the question: how is carbon related to the other environmental indicators? And which ones might we overlook?
If you follow Carbonfact, you may know that we like to build our work on scientific ground. Our methodology is based on the Product Environmental Footprint (PEF) methodology that is defined at the European Commission level.
The PEF details 16 indicators that are then grouped together in one aggregated score measured in PEF points (or written as µPt PEF). To compute that value, each environmental indicator is weighted. The table below gives the environmental indicator, unit, and weight in the aggregated PEF score.
13 of the 16 environmental indicators from the PEFCR listed by Ecobalyse. See more details here.
However, the PEF methodology has blindspots. There is no mention of microplastics or production volume. One can also wonder what the weights highlighted above are based on. On that note, it’s interesting to note that as part of the textile environmental labeling scheme starting in January 2024, the French government aims to enrich the PEF methodology with 8 additional indicators.
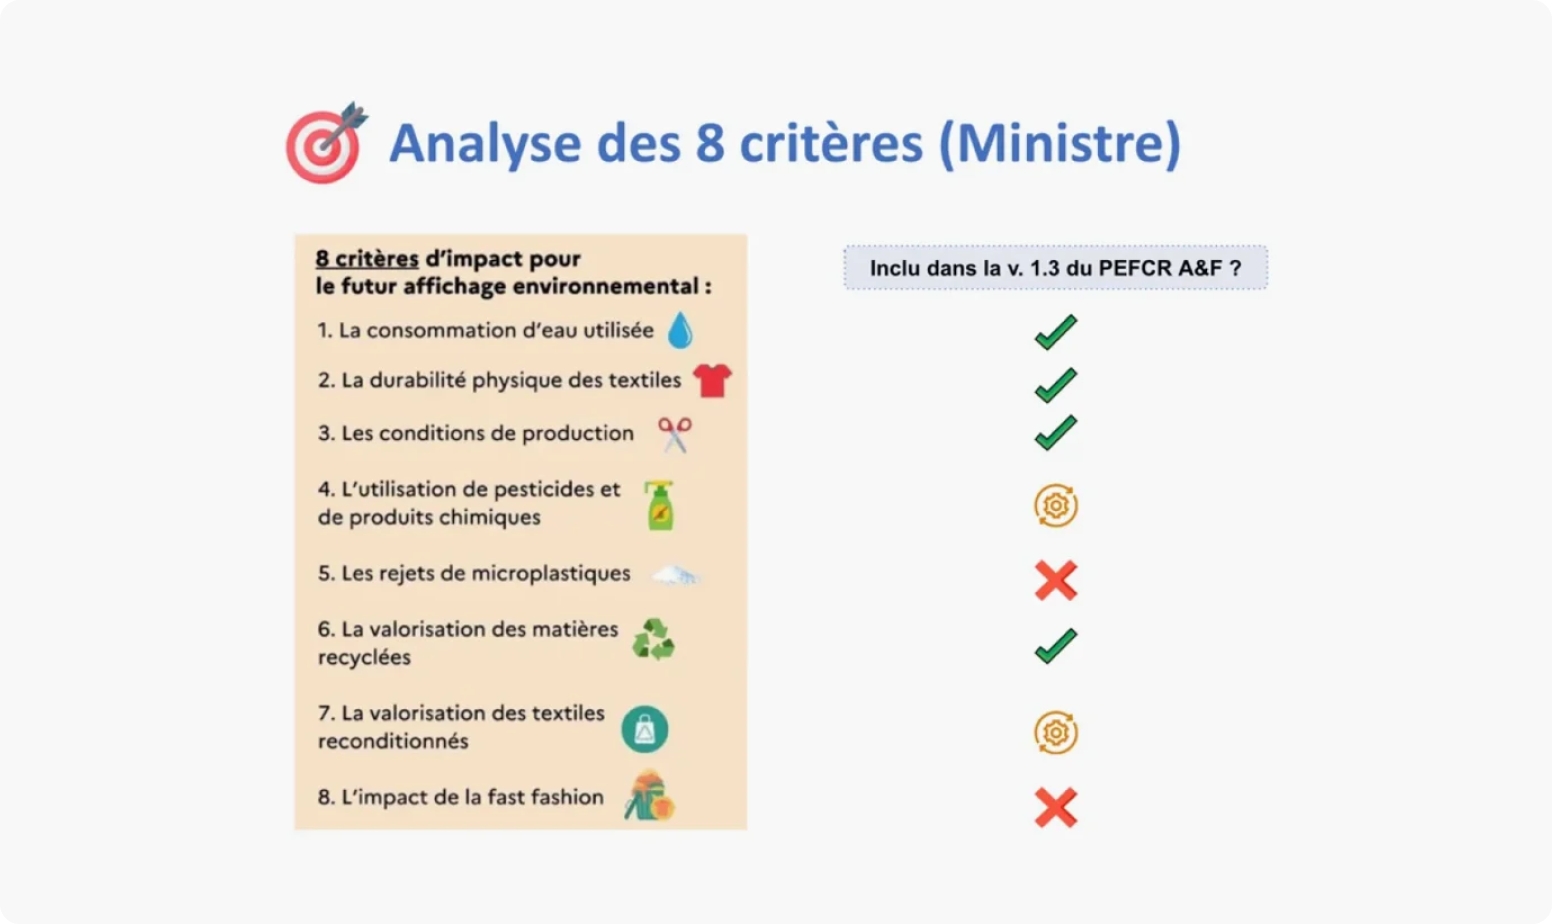
A comparison of the additional 8 environmental indicators asked by French minister Bérangère Couillard with v 1.3 PEFCR for Apparel and Footwear
So, since it’s the best standard out there, let’s use the PEF score: what’s the correlation between the PEF score and kgCO2e? Is there really a carbon tunnel? Are there environmental indicators that would be otherwise overlooked? Let’s dive in!
To answer those questions, I have decided to run simulations from Ecobalyse. Ecobalyse is an open source service led by the Ministère de la Transition Écologique. It aims at providing a standard approach to environmental measurement ahead of the upcoming regulations in France. Ecobalyse API is documented here and the code source that we have used is available here.
⚠️ Note that Ecobalyse is still under development, and currently uses ADEME BaseImpact database that is also limited and only 14 indicators out of the 16 detailed in PEFCR v 1.3 are available. With this in mind, please take the insights below with a grain of salt.
Our dataset contains 107184 rows, it is composed of 33 materials, 29 countries, 14 indicators and 8 production steps. In this example, we are only looking at simulations for a woven dress of 300g. We also picked the same country across all process steps. Following the advice from Alban and Paul (thank you Ecobalyse team!), we removed cashmere because it was an extreme outlier.
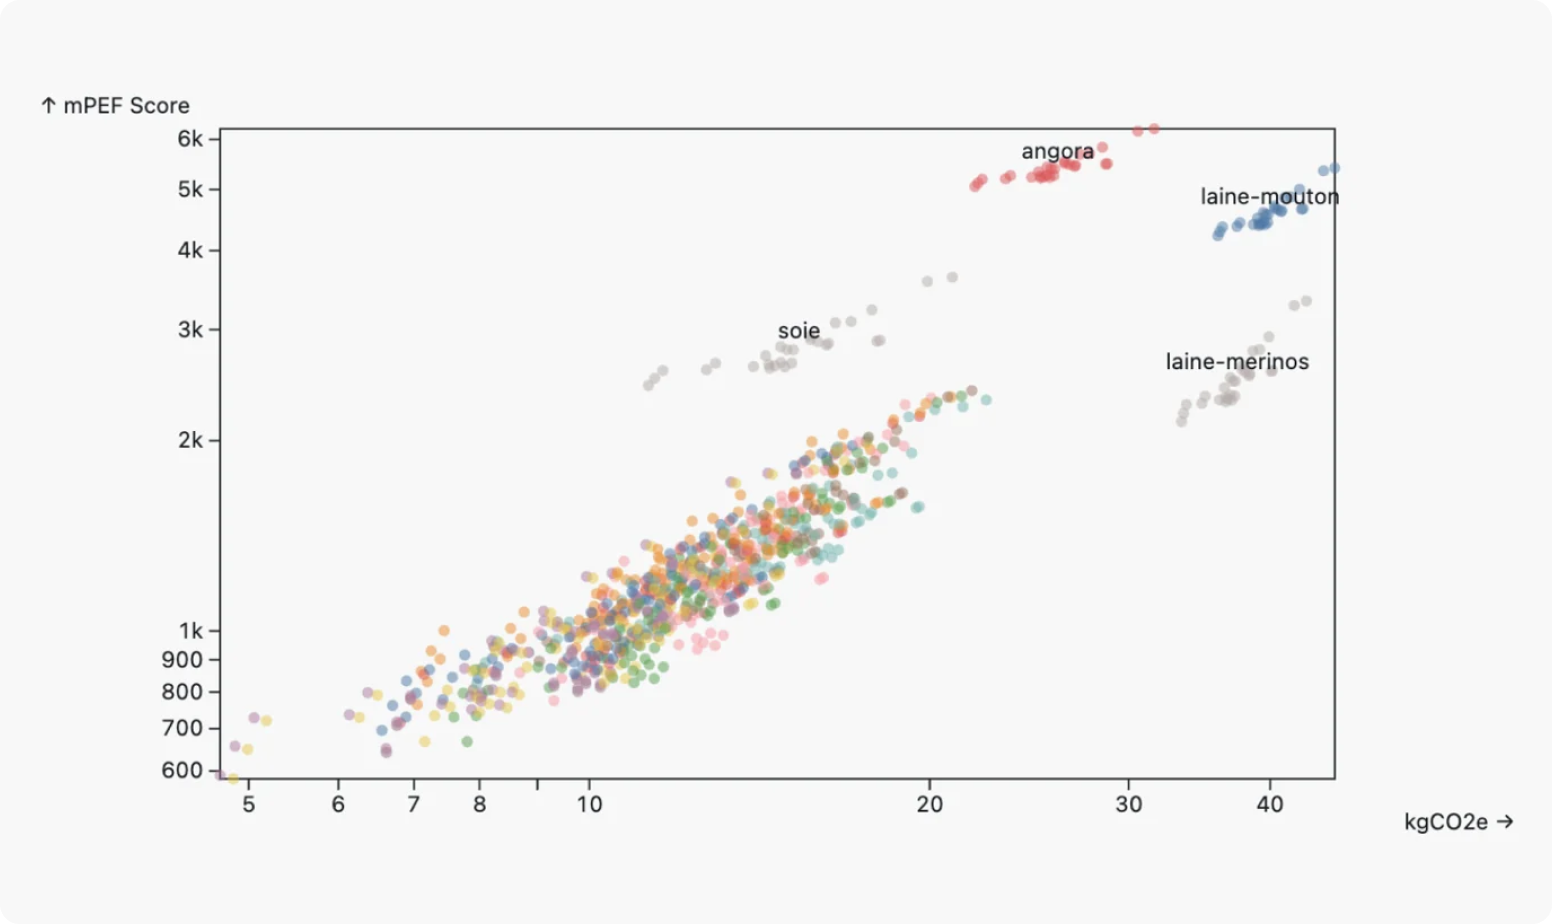
A visualization comparing kgCO2e and PEF. Each dot is one of the 957 simulations plotted on a logarithmic scale.
Below is a graph comparing the average PEF scores of different materials. As you can see under that framework, the animal-based fibers (in orange) have a higher environmental impact than other types of fibers.
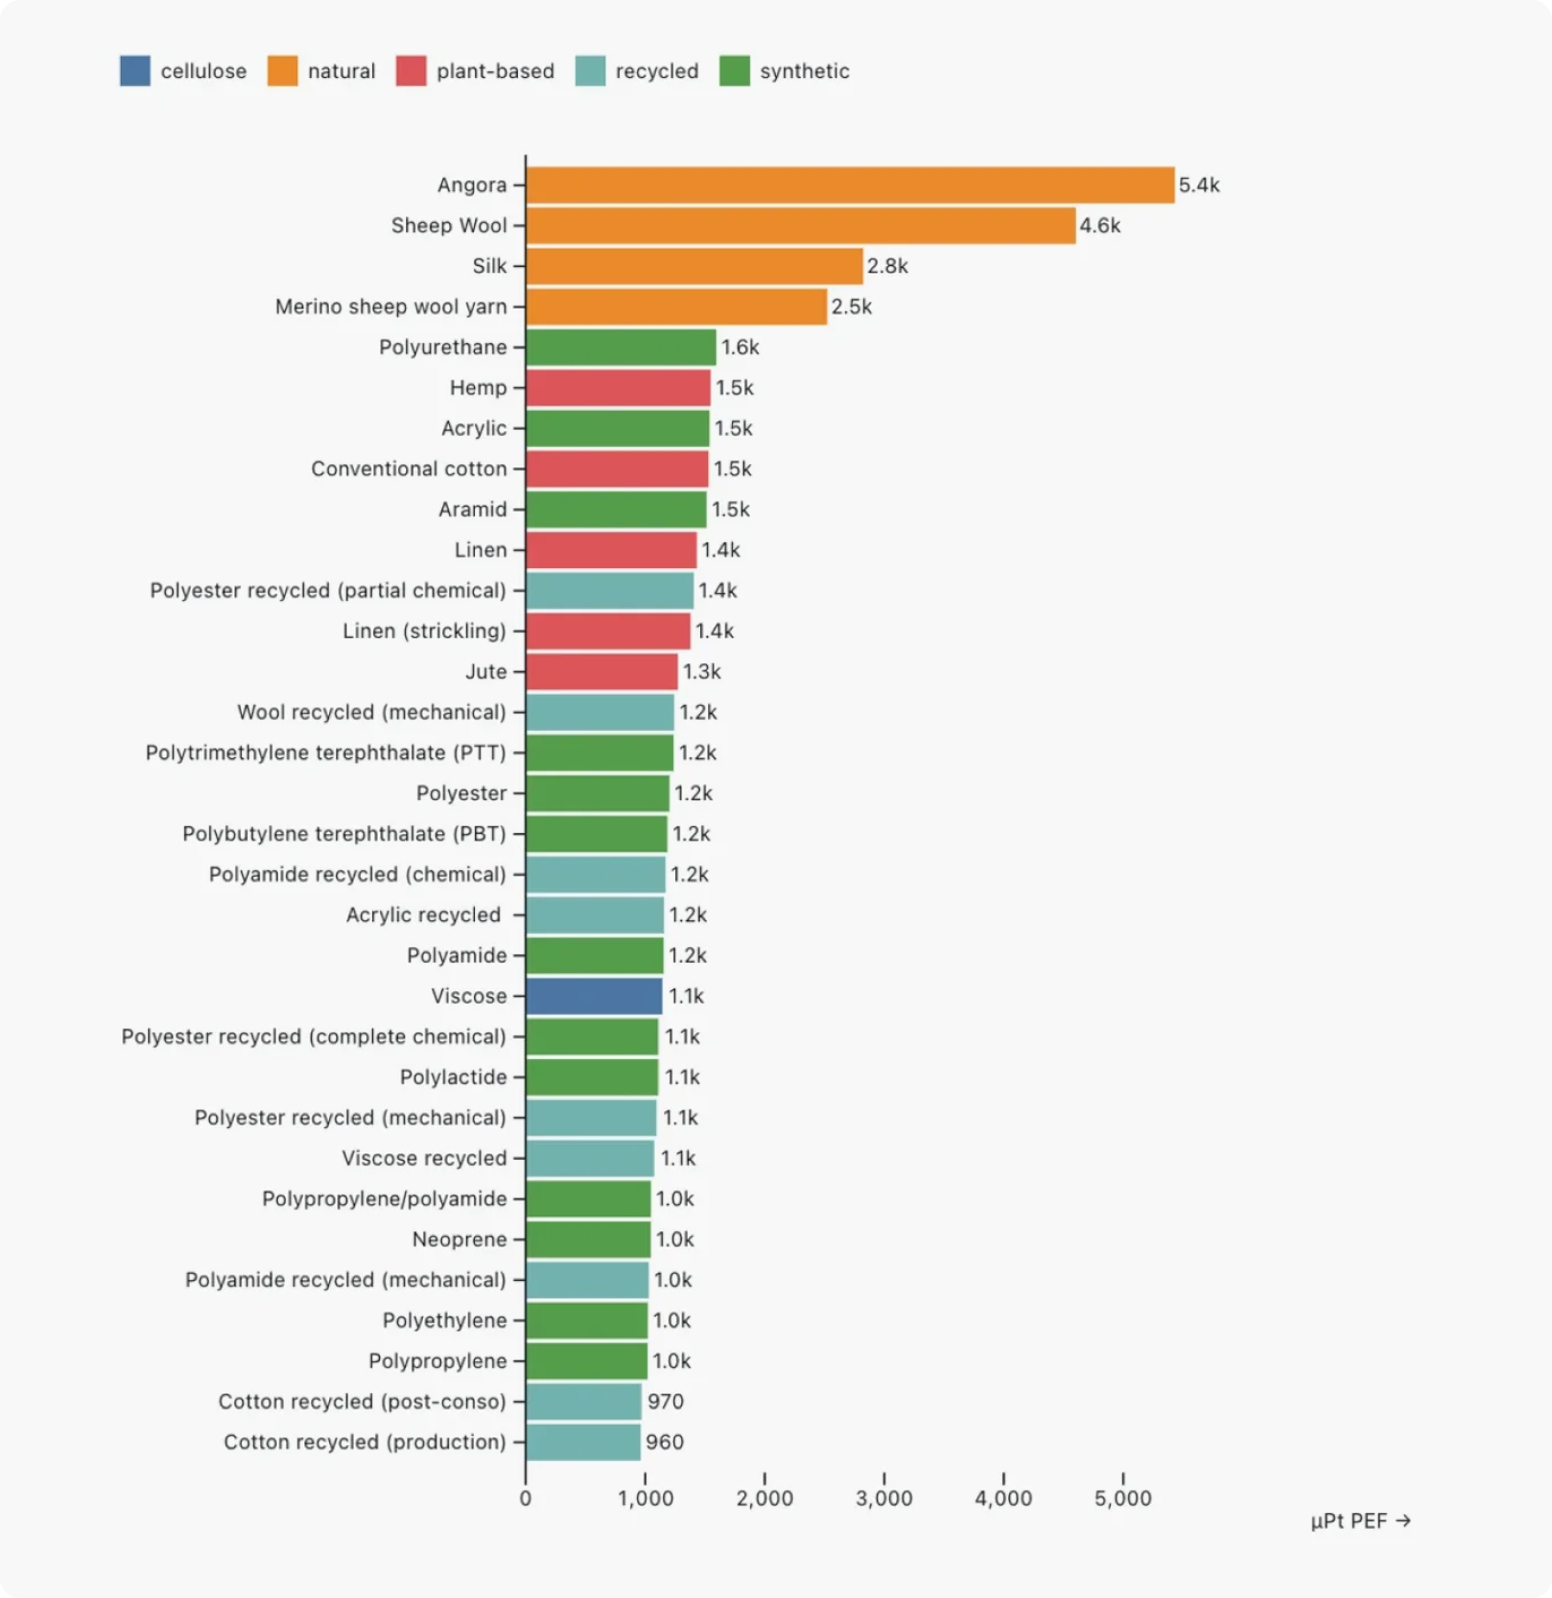
A dress made in Angora has the largest environmental impact with 5.4k PEF micro points, while a dress made in recycled cotton has the lowest impact at 960 PEF micro points.
What drives that score? Taking the example of Wool, ~20% of the PEF score is driven by climate change. ADEME BaseImpact - that underlines those values - assumes an economic allocation of 25%. That means that a quarter of the environmental impact related to sheep grazing is attributed to the wool material.
So let’s come back to our initial carbon tunnel question: how do the environmental indicators correlate with one another?
The matrix below displays the correlation between each indicator. The redder, the lower the correlation, the bluer, the higher. A score of 1 is a perfect positive correlation, a score of -1 is a perfect negative correlation.
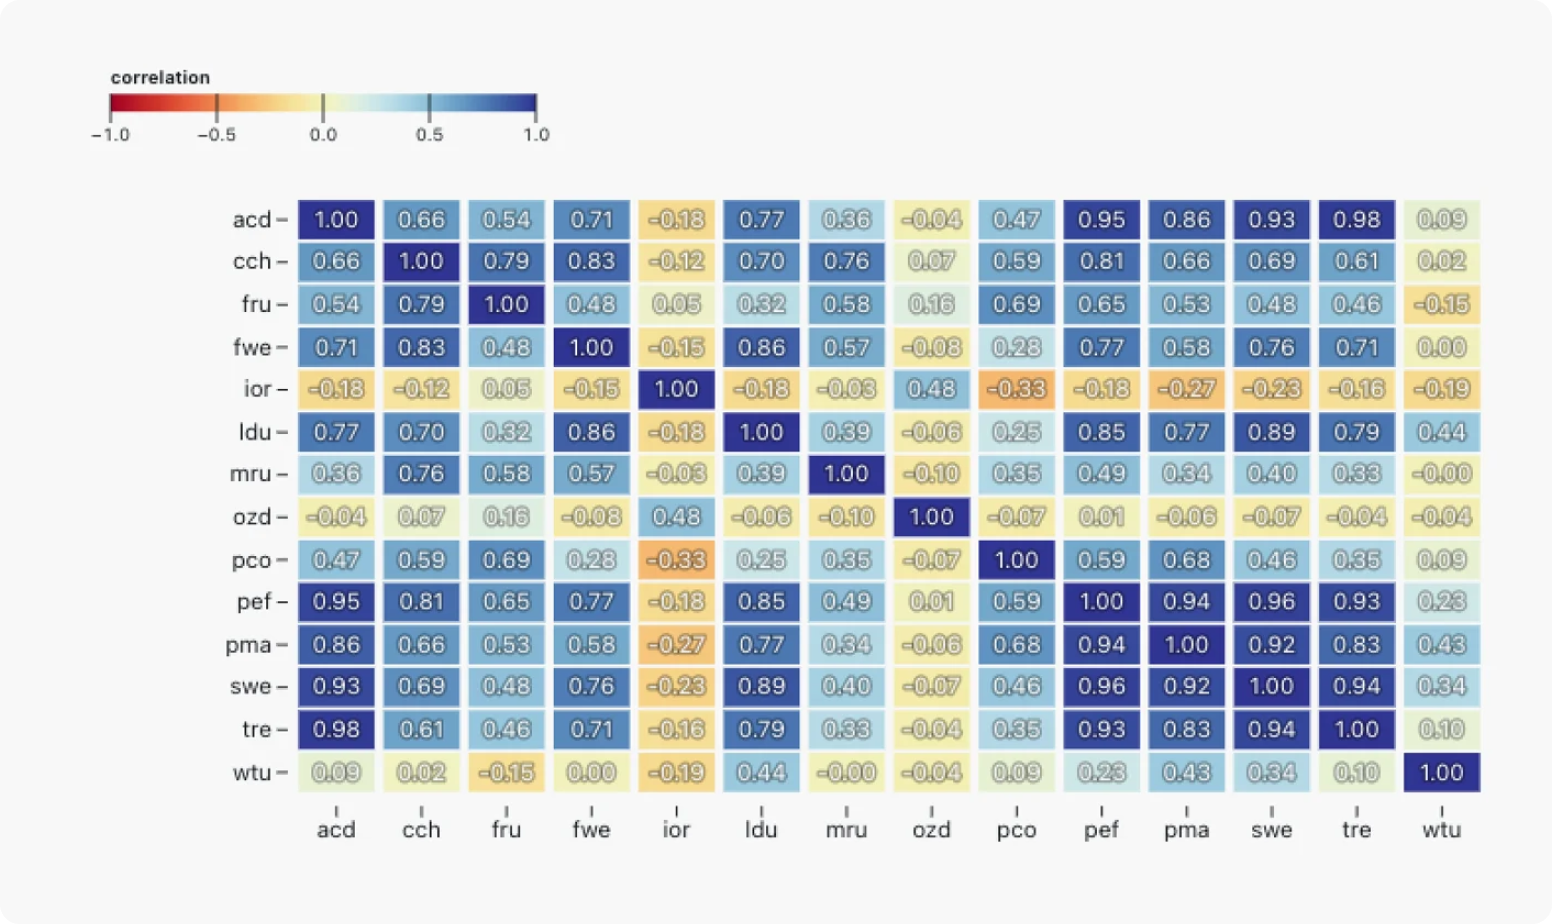
Here is what we can draw from it:
Regarding ionizing radiation, since those are emitted through nuclear reactions, the negative correlation makes sense: countries that have nuclear energy in their electric mix tend to emit less carbon but more ionizing radiation.
Positive relationship with indicators such as particles or fossil fuel also makes sense since energy sources like coal both emit carbon and particles. Also, the more you rely on fossil fuels, the higher the carbon footprint.
Water usage is the real learning for me here. One caveat is that those results are limited since Ecobalyse data only works at the raw material step (learn more here). For instance, we know that wet treatment and dyeing are large water consumption production steps.
The table below gives the climate change and the water usage impact to produce 1kg of materials. Those could be examples of “carbon tunnel” materials where only focusing on climate change may overlook the impact on water usage.
Producing 1kg of Silk material emits “only” ~6kgCO2e but requires ~15m3 of water.
Carbonfact just launched Multi-criteria indicators and now measures across the 16 indicators recommended by the Product Environmental Footprint (PEF). Read everything about the new feature here.


Environmental intelligence platform - built for apparel and footwear brands, and their suppliers.