

Environmental intelligence platform - built for apparel and footwear brands, and their suppliers.

-1.jpg?width=48&height=48&name=430471923_947159710328078_7998316763082046126_n%20(1)-1.jpg)
"You Ask, We Answer" – brought to you by Carbonfact's Head of Science. Each week Laurent Vandepaer, PhD, together with Carbonfact's Science Associate Vincent Carrières, answers one of your questions about sustainable materials, manufacturing impact, and energy transition in the apparel and footwear industry.
Before joining Carbonfact, Laurent led the integration of LCA into the sustainability and innovation efforts at On and performed LCA for other brands like Arc'teryx. Vincent joined Carbonfact after three years as a sustainability expert at Quantis, where he specialized in LCA and corporate footprinting.
Question: What is the carbon footprint of organic vs. conventional cotton? Does organic cotton consume less water than conventional cotton?
Asked by the Head of Sustainability from an apparel brand
Durable, breathable, and renewable, cotton is one of the most widely utilized natural materials in the fashion and textiles industry. According to the Textile Exchange Materials Market Report 2025, cotton remains the second most widely produced fiber after polyester, accounting for 19% of global fiber production in 2023/24.
Conventional cotton farming often involves heavy use of chemicals. Pesticides applied to cotton can pollute the soil and both ground and surface water, with potential drift affecting nearby crops. Additionally, the widespread use of synthetic fertilizers to boost yields contributes to water contamination and substantial greenhouse gas emissions.
The cotton market has long lacked the transparency needed to obtain reliable data. Complex global supply chains with multiple intermediaries make it hard to trace cotton from farm to finished product, while inconsistent data collection and varying standards across regions and Life Cycle Assessment (LCA) studies obscure cotton's true environmental and social impacts.
This is now beginning to change: recent work, including the 2026 Textile Exchange cotton LCA and a new farm-level study on organic cotton in India, brings more recent, region-specific data to a field that has long relied on outdated or aggregated figures.
We cover it all in the article below – let’s dive in!
Organic cotton is produced from the same plants as conventional cotton, but the key difference lies in its cultivation. Organic farming methods avoid using synthetic pesticides, chemical fertilizers, and other synthetic substances, focusing instead on natural processes to support plant growth and soil health.
Cultivation: The growth of cotton plants, with organic farming using natural inputs like compost rather than synthetic fertilizers.
Harvesting and ginning: Raw cotton is harvested and the fibers are separated from the seeds.
Opening, cleaning, blending, and carding: Raw cotton is cleaned and prepared for spinning.
Spinning, weaving, or knitting: Cotton fibers are spun into yarn and then woven or knitted into fabric.
Dyeing, printing, and finishing: The final stages where the fabric is dyed, printed, and finished for use.
.png?width=1552&height=1010&name=box%20(28).png)
This process is followed for both organic and conventional cotton, though organic methods aim to minimize environmental impacts at every stage.
In March 2026, Textile Exchange published a long-awaited cotton LCA report covering country averages, organic, regenerative, and recycled cotton.
This report is a significant step forward for cotton LCA data. It addresses the main gaps flagged in previous studies (outdated data, missing regional resolution, inconsistent field-emission modeling) and follows the industry-aligned Cascale Cotton LCA Methodology.
Carbonfact has integrated the new Textile Exchange datasets for Organic cotton and Regenerative cotton into the platform. The table below shows the previous values (sourced from EF 3.1), the new values, and why the change matters.
Our cotton figures and the new Textile Exchange study are built on two different reference databases: we use ecoinvent, while the study uses Sphera. Numbers from different databases can vary, so we updated cotton only where the new data brings a clear improvement over our previous EF3.1 values (some of which had been flagged as faulty), where important data gaps were encountered (regenerative cotton datasets), and where it stays consistent with the rest of our materials datasets.
We've held off on a few cases: conventional and recycled cotton (until the Textile Exchange data is integrated into ecoinvent, ensuring consistency with the rest of our materials database), organic cotton from Brazil (where we first want to verify alignment with our own land-use-change methodology before integrating), and organic cotton from Tanzania (a small producer with data still too uncertain to rely on).
As ecoinvent updates its own cotton data to match this new study, we'll bring the rest in line.
For Carbonfact’s clients, this matters for sourcing decisions and reporting – product footprints for organic and regenerative cotton now reflect more recent, region-specific inventory data.
There are several important considerations to keep in mind when interpreting the LCA findings:
What "regenerative" means in this study and what it doesn't
There is no universal definition of regenerative agriculture. In this study, regenerative systems are certified or self-identified and use practices such as reduced tillage, organic fertilizers, and integrated pest management.
Important caveats: regenerative systems are highly site-specific, several of their benefits (soil carbon, biodiversity) only materialize over time, and the study uses screening-level indicators rather than direct measurements. The data should not be read as a definitive ranking of regenerative vs. other systems.
The datasets are directional, not a basis for country-level sourcing decisions
Textile Exchange is explicit on this point: results carry meaningful uncertainty (especially around organic yields, irrigation water, nutrient content of organic fertilizers, and pesticide rates). Recommended use is hotspot analysis, Scope 3 reporting, scenario modelling and benchmarking, not switching suppliers or countries based on the numbers alone.
The LCA framework alone does not tell the full story
Textile Exchange's LCA+ approach adds three dimensions that sit outside our standard 16-indicator framework: soil health (assessed via soil organic carbon), biodiversity (assessed indirectly via land use, eutrophication, pesticides, water), and a human rights screening based on a 20-question survey and expert interviews.
The human rights survey notably found that the cotton cultivation system (organic/regenerative/conventional) is not the main driver of social impacts – local legislation, infrastructure, and mechanization matter more.
These dimensions should be considered alongside the LCA results when making sourcing decisions.
The table below shows the analysis before/after Carbonfact's 2026 Textile Exchange LCA integration on cotton datasets.
Regional differences in cotton emissions are influenced by synthetic fertilizer use, irrigation, and energy sources for ginning. Organic systems generally show lower emissions than conventional, though results vary by geography depending on local farming practices and climate conditions.
Note that these figures are intended for hotspot analysis and benchmarking – the Textile Exchange LCA report explicitly states that results should not be used for direct comparisons between countries or farming systems.
One correction stands out: EF 3.1 data showed organic cotton in India with a higher footprint than conventional – a data quality issue flagged by our Science team. This has since been corrected: Carbonfact's integration of the 2026 Textile Exchange LCA brings the Indian organic cotton value from 4.82 kg CO₂e/kg down to 1.46 kg CO₂e/kg, reflecting more representative inventory data.
For a closer look at organic cotton farming in India, a dedicated LCA study from the Organic Cotton Accelerator and South Pole, based on primary data from ~18,000 Indian farms, provides grounded evidence – covered in the next section.
India accounts for over 50% of global organic cotton production. The LCA study from the Organic Cotton Accelerator (OCA) and South Pole provides a detailed primary-data assessment of Indian organic cotton.
The study covers the production of 1 kg of lint cotton from field to ginning gate, and draws on primary data from approximately 18,000 organic farms across India over three years.
According to the study, below are the GHG emissions by production system:
The main emissions hotspot in the OCA study is N₂O from on-field fertilizer application, not fertilizer production or irrigation. This differs from the 2021 Better Cotton Initiative LCA (see next chapter), where upstream fertilizer production was the largest contributor. The difference is likely methodological: the OCA study uses farm-level primary data.
It is also worth noting that the "Conventional" group in the OCA study represents farms in areas where organic programs are active, not a national average, and likely reflects better-than-average practices compared to the broader Indian conventional sector.
The study has a few limitations:
In 2021, the Better Cotton Initiative (BCI) commissioned an LCA study comparing the carbon footprint of Better Cotton versus conventional farming methods.
The Better Cotton Initiative promotes sustainable cotton farming by improving water management, reducing pesticide use, and enhancing soil health. Better Cotton is not a specific type of cotton but operates as a labeling system for cotton grown under BCI guidelines.
These guidelines include criteria such as efficient water use, reducing synthetic pesticide reliance, improving soil health through crop rotation, and ensuring fair labor practices. Find more on BCI principles and criteria here.
The study examines emissions from production to ginning in key regions like India, Pakistan, China, Brazil, and the U.S., aiming to reduce the environmental impact of cotton farming.
Here are some important factors highlighted by the BCI study when evaluating the LCA of cotton:
Importance of fertilizer production: The BCI study reveals that fertilizer production is the largest contributor to GHG emissions in cotton production, accounting for 47% of total emissions on average. Organic cotton farming relies on natural fertilizers like compost and manure instead of synthetic nitrogen fertilizers, though the breakdown of these organic fertilizers in soil can still release nitrous oxide.
Irrigation: Irrigation is the second-largest contributor to GHG emissions in cotton production, accounting for 17% of total emissions on average. Pumping, transporting, and distributing water requires energy, which generates emissions. The contribution of irrigation varies considerably by region, depending on rainfall, irrigation methods, and water sources.
Fertilizer application: The application of nitrogen fertilizers results in emissions of nitrous oxide (N₂O), a potent greenhouse gas. Although fertilizer production is responsible for a larger share of emissions, the application itself contributes 12% of total emissions on average.
Ginning: The ginning process, which involves separating cotton fibers from seeds, consumes energy and generates GHG emissions. The emissions intensity of ginning depends on the energy source used and the efficiency of the ginning plants. Ginning accounts for 11% of total emissions from Better Cotton production.
Other sources: Other sources of GHG emissions, such as crop residue management, field operations, pesticides, and transportation of cottonseed to the gin, collectively contribute a relatively small share of total emissions.
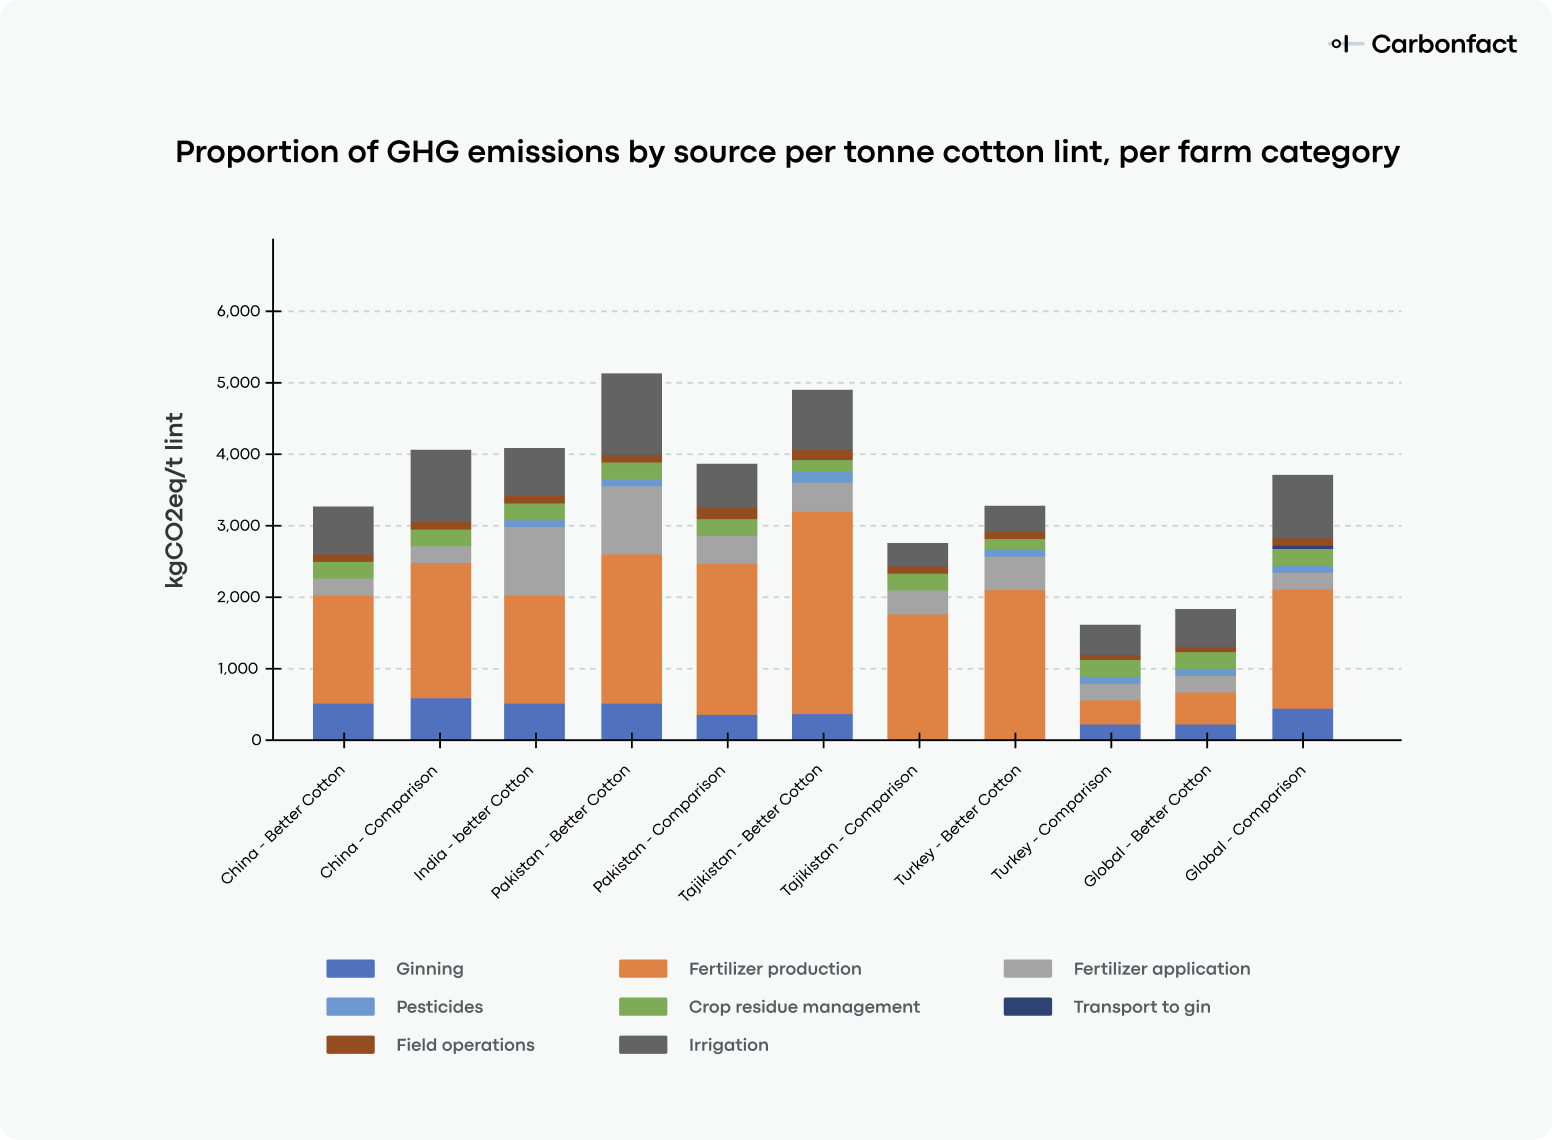
(Source: 2021 Better Cotton Releases Study on GHG Emissions)
Over 200,000 farm assessments from 2015-16 to 2017-18 analyzed, using the Cool Farm Tool to calculate GHG emissions. Better Cotton provided primary data on inputs, farm sizes, production, and locations, with gaps filled through desk research where necessary.
In the study, it seems surprising that the emissions from fertilizer production are much higher than emissions from fertilizer application – a discrepancy that is not specifically addressed in the BCI study. As the study is from 2021, they likely used Global Warming Potential (GWP) values from the previous assessment report.
The study has several important limitations:
Note: While we cite these results for reference, this does not constitute an endorsement of BCI cotton.
The challenge in comparing water usage between organic and conventional cotton lies in the fact that regional factors, such as climate and irrigation methods, play a significant role, making broad claims difficult. The water impact can happen at every stage of cotton production but is likely to be higher during farming and dyeing, especially if these processes occur in water-deprived countries.
The EF 3.1 database provides water scarcity impact scores about water use relative to the local scarcity of water in different countries using the AWARE method. This is expressed in m³ deprived, meaning how much water the farms "take away" from the available local water supply.
The global average for organic cotton is 125.6 m³ deprived while it is 87.28 m³ deprived for conventional cotton, indicating a higher water stress caused by organic cotton. For comparison:
The average water use for organic cotton is higher because some countries that grow a lot of organic cotton use much more water than others. For example, countries like Kyrgyzstan, Turkey, and Tajikistan contribute a significant share of the global market, with 10%, 10%, and 5% respectively, and are driving up the global average:
Kyrgyzstan: 444.24 m³ of water per kilogram of cotton
Turkey: 188.61 m³ of water per kilogram of cotton
Tajikistan: 464.23 m³ of water per kilogram of cotton
Despite these regional differences, there is no conclusive evidence from critically-reviewed studies that prove organic-cotton farming uses less water than conventional methods. Whether cotton is grown organically or conventionally does not necessarily determine the amount of irrigated water used.
The total volume of organically farmed cotton is uncertain, largely due to widespread fraud in the market. This fraud typically occurs when conventional cotton is deliberately mislabeled as organic to capitalize on premium prices and growing demand. Several factors enable this deception:
Organic cotton certification standards were developed to address these issues. These standards require farmers to:
Here's an explanation of each part of the Organic Cotton Certification system:
Governments: To be legally sold as “organic”, raw cotton must come from farms certified under government-regulated organic standards. For example, India’s National Programme for Organic Production (NPOP) certifies a large portion of the world’s organic cotton, aligning with international standards.
Voluntary Standards Scheme Owners: Standards like Textile Exchange's Organic Content Standard (OCS) and the Global Organic Textile Standard (GOTS) use chain-of-custody models to track organic cotton volumes throughout the supply chain.
Certification Bodies: Governments and voluntary standard organizations like GOTS and Textile Exchange do not conduct certifications themselves. Instead, certification bodies verify compliance at farms and facilities, with different bodies focusing on different aspects of the supply chain.
Organic farming systems have the potential to maintain and enhance the health of soils, ecosystems, and communities by utilizing ecological processes, biodiversity, and locally adapted cycles, instead of relying on external inputs that may cause harm.
For example, rather than applying synthetic nitrogen fertilizers – which contribute to significant greenhouse gas emissions during production and use, and can negatively impact soil health and water quality – organic farmers use methods like crop rotation and green manures to naturally enrich the soil.
Brands can support farmers transitioning to organic cotton by partnering with them to promote low-carbon practices, investing in programs that encourage organic farming, and purchasing "in-conversion" cotton (cotton grown by farmers who are in the process of transitioning from conventional to organic farming methods) to help share financial risks during the certification period.
The cotton supply chain is among the longest and least transparent in the fashion industry, making brands susceptible to new regulations on supply chain due diligence and the demand for substantiating green claims with reliable, verifiable data.
Carbonfact is the Environmental Data Platform built specifically for apparel and footwear brands, as well as manufacturers, to measure the environmental impact of their products and take actionable steps to track and reduce their footprint.
Carbonfact's platform displays detailed process steps not only for products, but also for each material and fabric used in your products. You can filter through your materials by supplier, raw material type, and any of your own custom properties.
Our Product Impact Simulation tool enables you to run what-if scenarios on a product level, where you can experiment with different materials, preparation techniques, suppliers, renewable electricity share, or transportation methods, and build concrete company-level decarbonization scenarios.
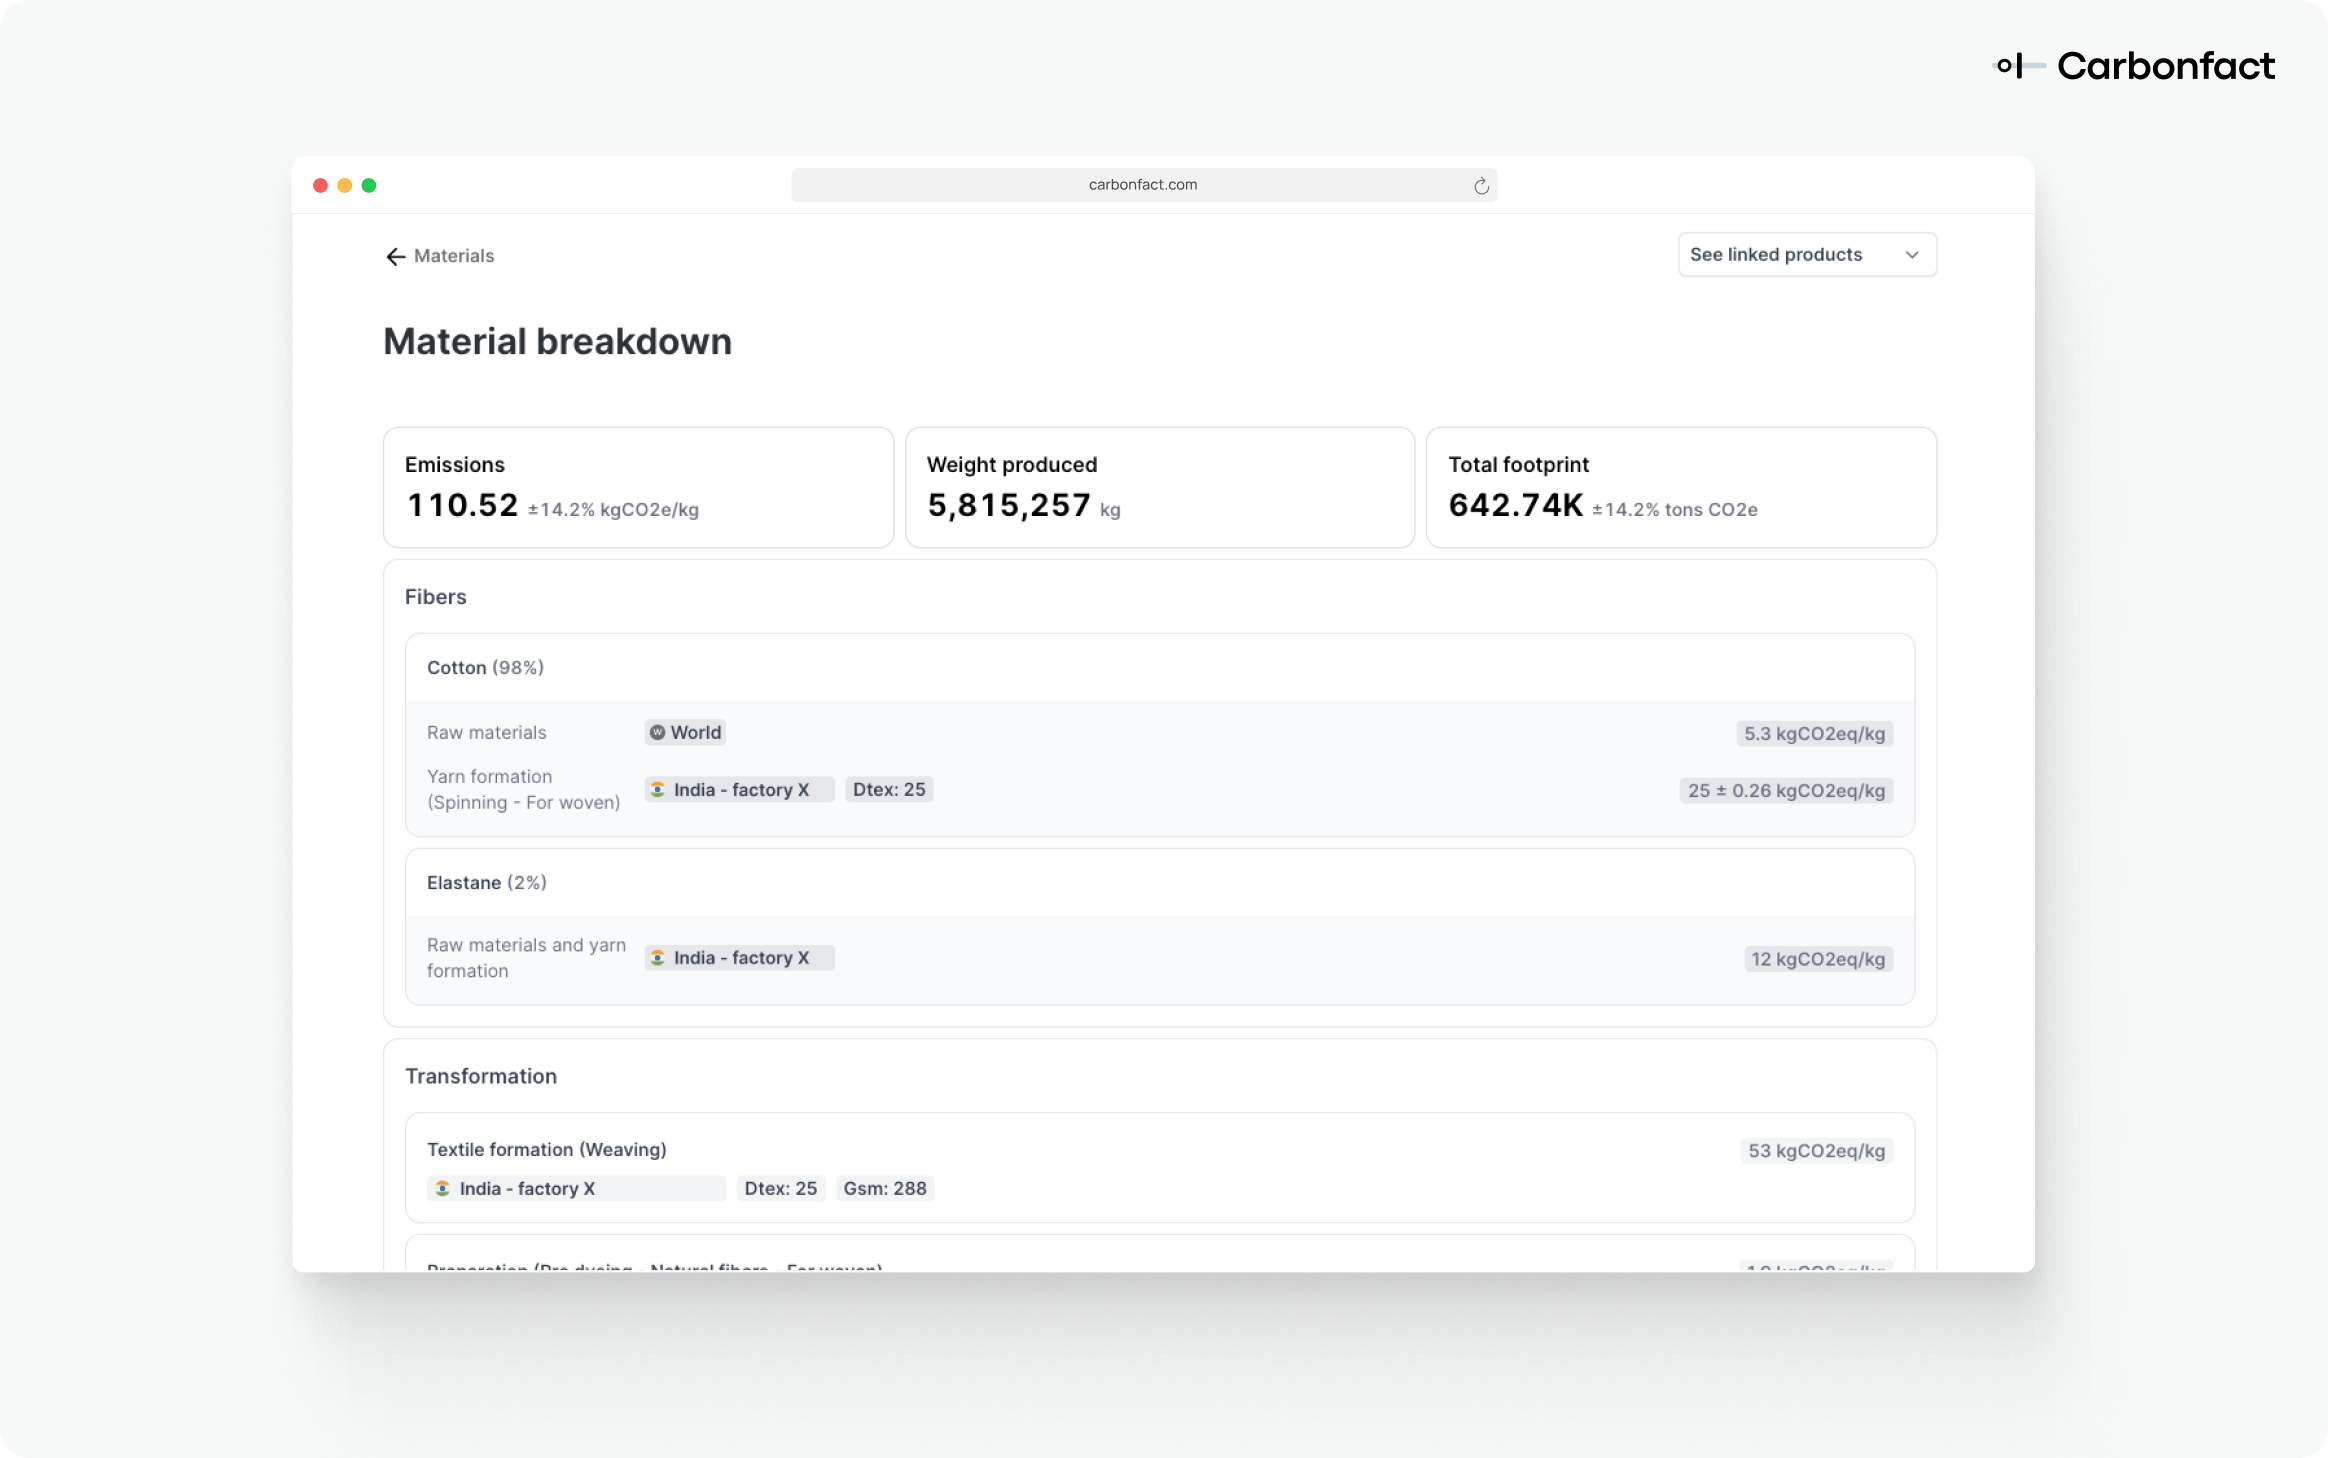
(Carbonfact's platform)
Curious to learn more about the environmental impact of other key materials? Deep dive into our previous series:
Carbon footprint of polyester 🛢️
Do you have questions about sustainable practices, manufacturing impacts, or energy transitions in the apparel and footwear industry? We'd love to hear from you! Comment, send us a DM on Linkedin, or email: youaskweanswer@carbonfact.com

-1.jpg?width=100&height=100&name=430471923_947159710328078_7998316763082046126_n%20(1)-1.jpg)

Environmental intelligence platform - built for apparel and footwear brands, and their suppliers.